- Home
- Education
- Trading Analysis
- Double Top Chart Pattern
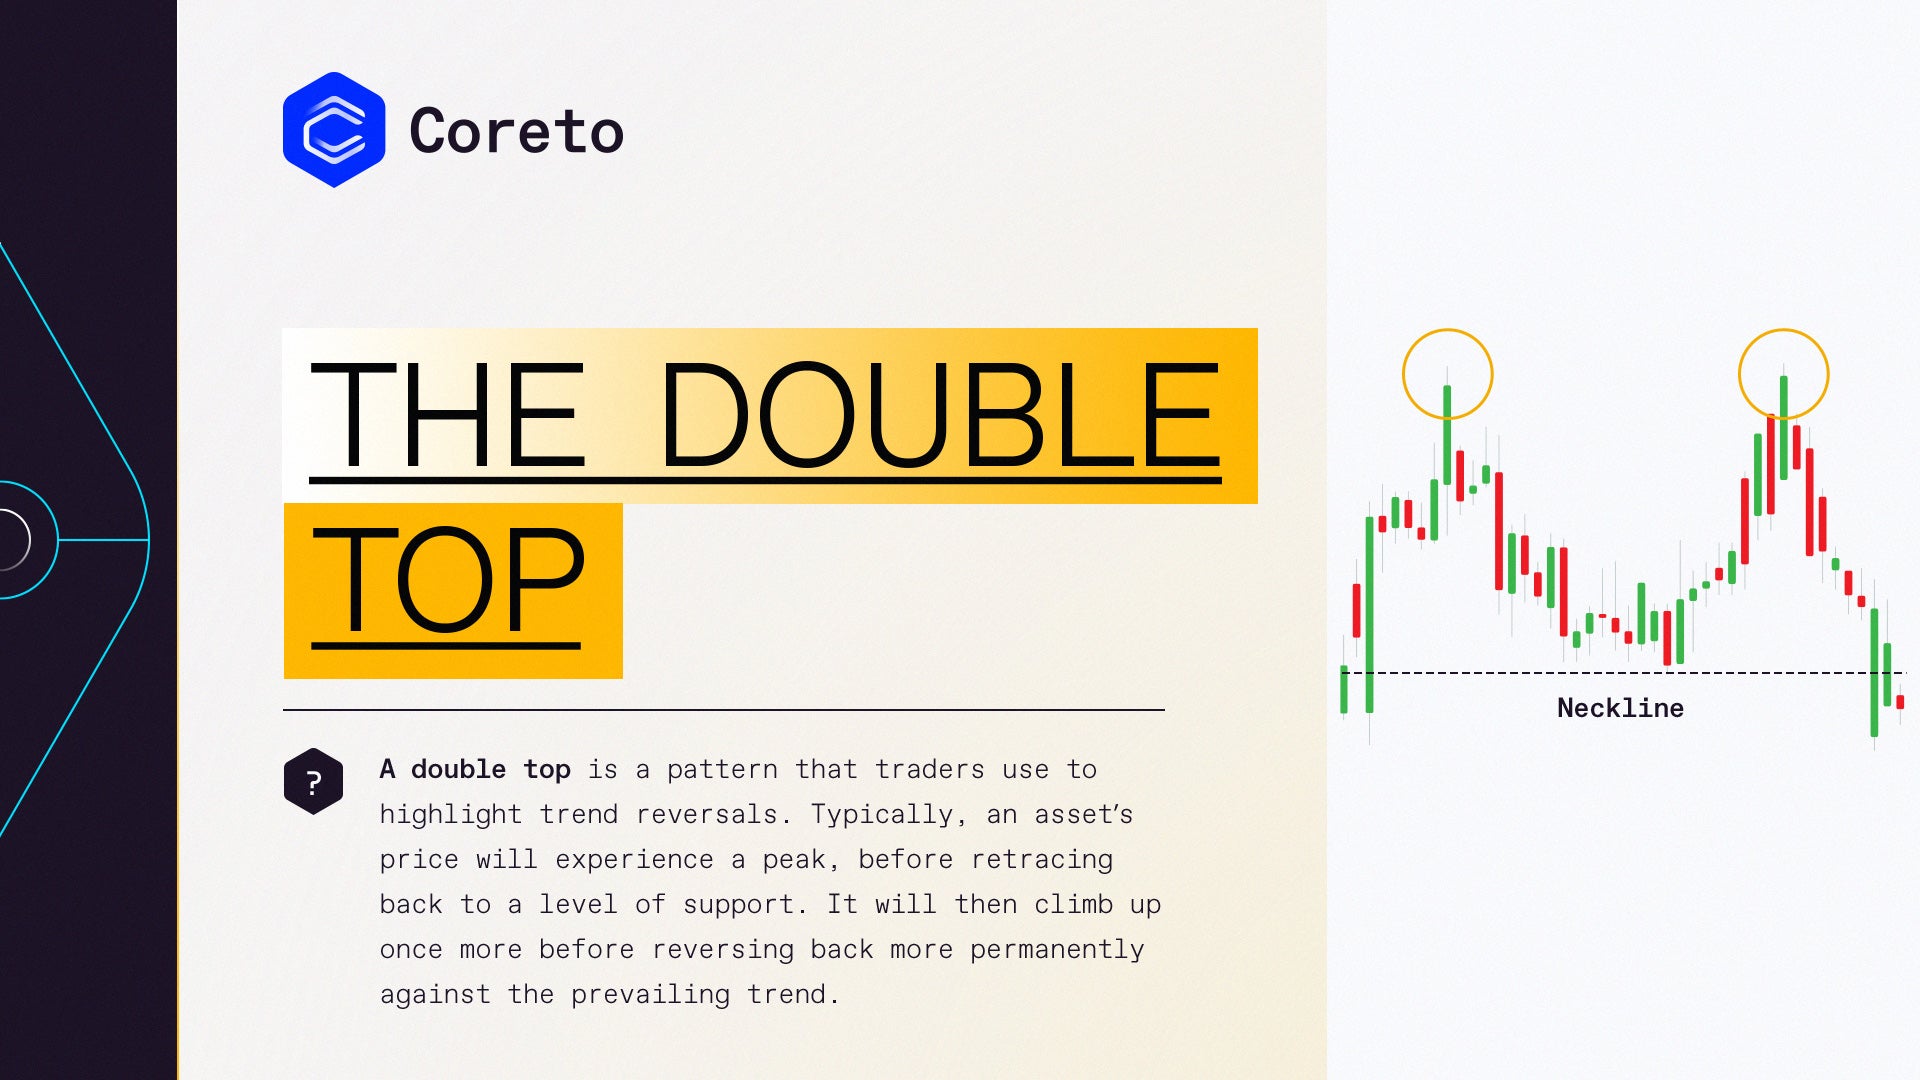
Double top pattern market signal
The double top pattern entails two high points within a market which signifies an impending bearish reversal signal. A measured decline in price will occur between the two high points, showing some resistance at the price highs.
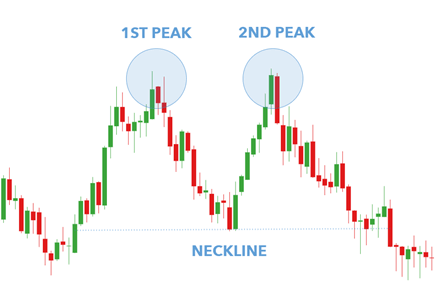
After retracing a portion of the first peak, the market rallies back towards the high of the first peak however, strength in the market is waning and is unable to sustain a break above the first peak.
There are two ways to trade using the double top and double bottom patterns: you’d open
- a short position on a double top, and
- a long position on a double bottom.
Before you start, it is important to confirm the signal with other technical indicators such as the relative strength index (RSI), which is a momentum indicator.
The patterns to trade are the ones where your potential reward, based on the profit target, is at least twice as much as your risk.
Overall, when this pattern occurs, taking long positions may not be ideal for the time being, and more focus should be given to finding short entry positions.

