- Home
- Education
- Indicators
- The Average Directional Index ...
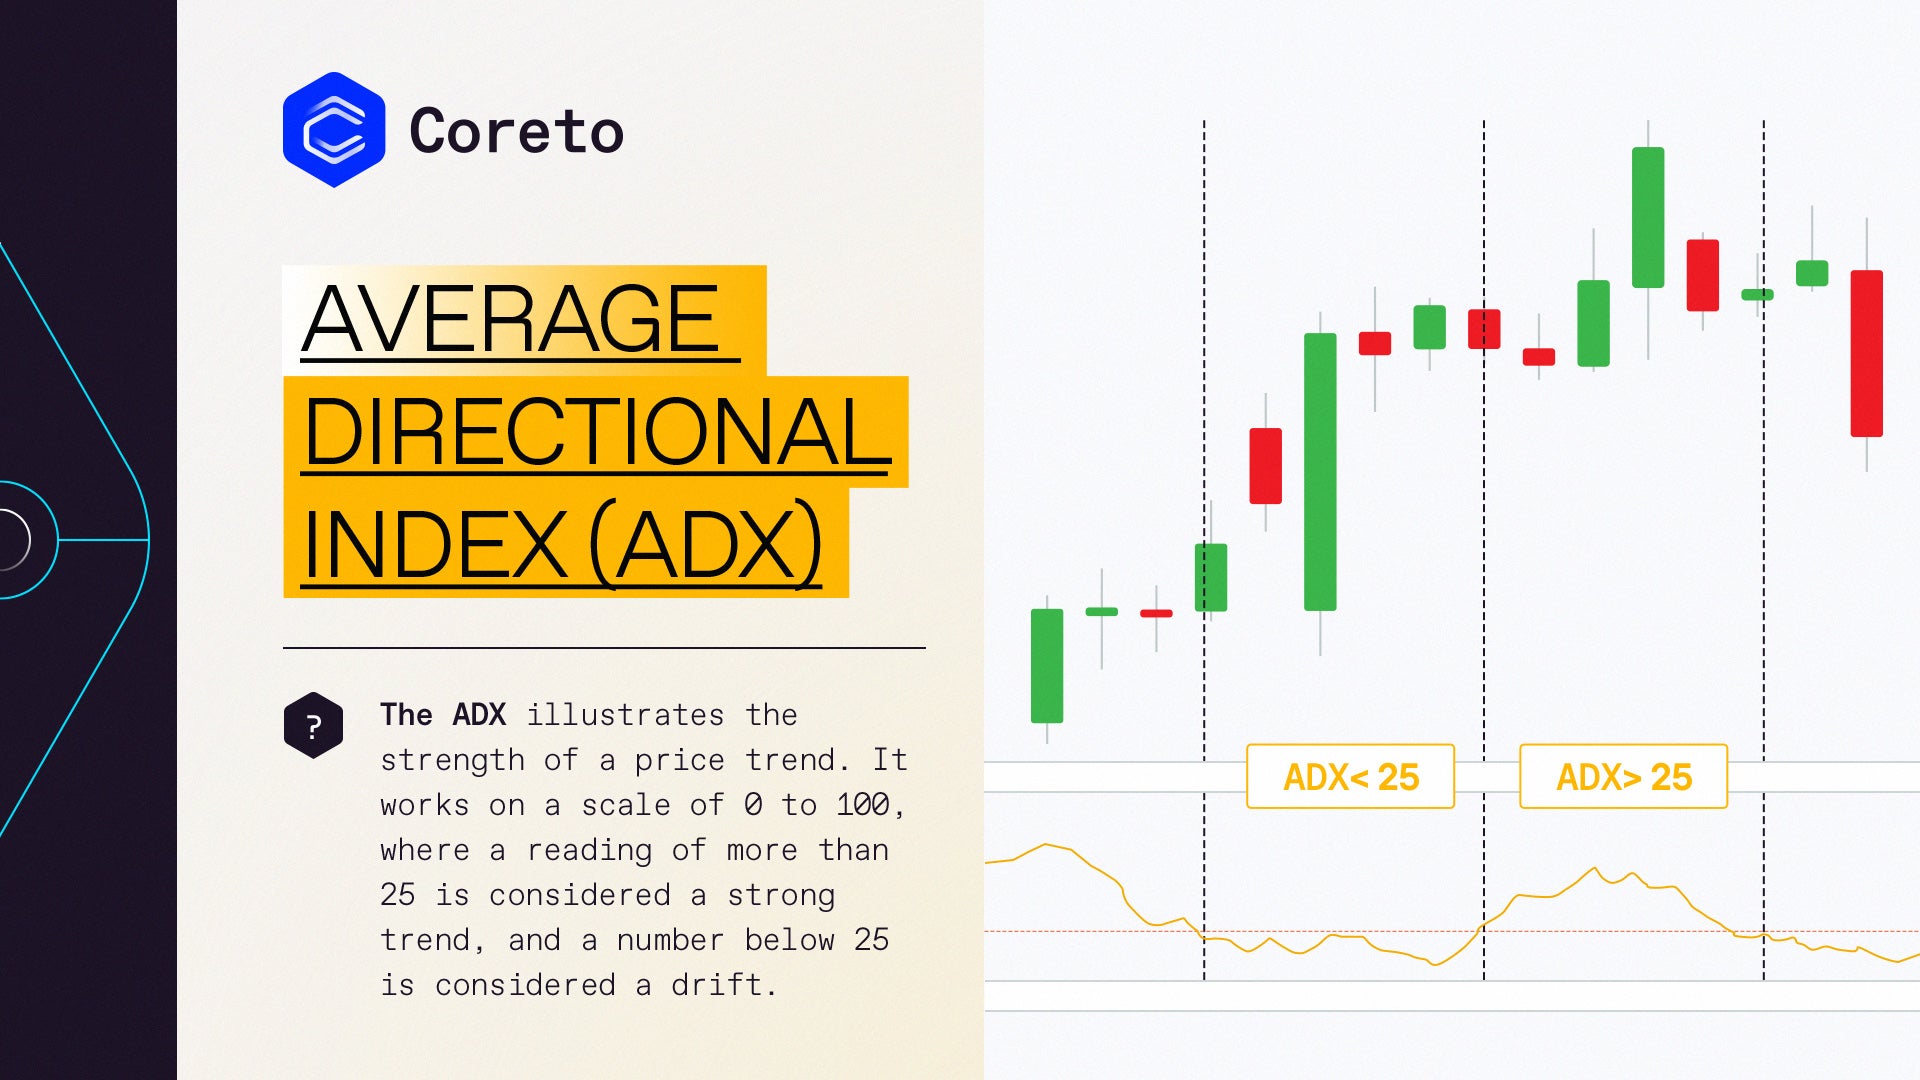
Some traders use The Average Directional Index (ADX) is a technical analysis indicator to determine the strength of a trend.
We can define Directional Movement (DM) as the largest part of the current period’s price range that lies outside the previous period’s price range. For each period calculate:
- +DM = positive or plus DM = High – Previous High
- -DM = negative or minus DM = Previous Low – Low
The indicator determines first of all whether a market is trending at all, as opposed to merely trading back and forth within a range, and secondly to determine the strength of a trend in a trending market.
Average directional index (ADX)- other uses
Finally, the average directional index is also often used, as other momentum indicators are, to point out a potential market reversal or trend change.
When the value of the average directional index line is below 25, a market is considered to be ranging rather than trending.
Some analysts peg only average directional index readings below 20 as indicative of the absence of a trend, and readings between 20 and 25 as possible, but not conclusively, indicating the presence of a trend:
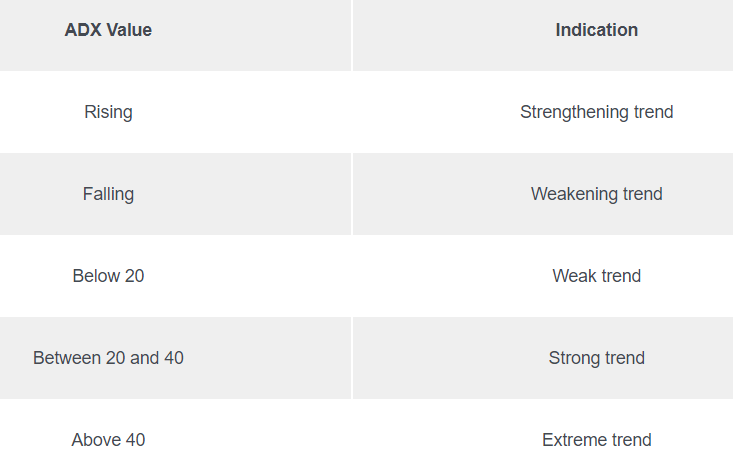
One way to trade using ADX is to wait for breakouts first before deciding to go long or short.
ADX can be used as confirmation whether the pair could possibly continue in its current trend or not.
Another way is to combine ADX with another indicator, particularly one that identifies whether the pair is heading downwards or upwards.
ADX can also be used to determine when one should close a trade early.
For instance, when ADX starts to slide below 50, it indicates that the current trend is losing steam.
From then on, the pair could possibly move sideways, so you might want to lock in those pips before that happens.

