- Home
- Education
- Indicators
- Bollinger Bands
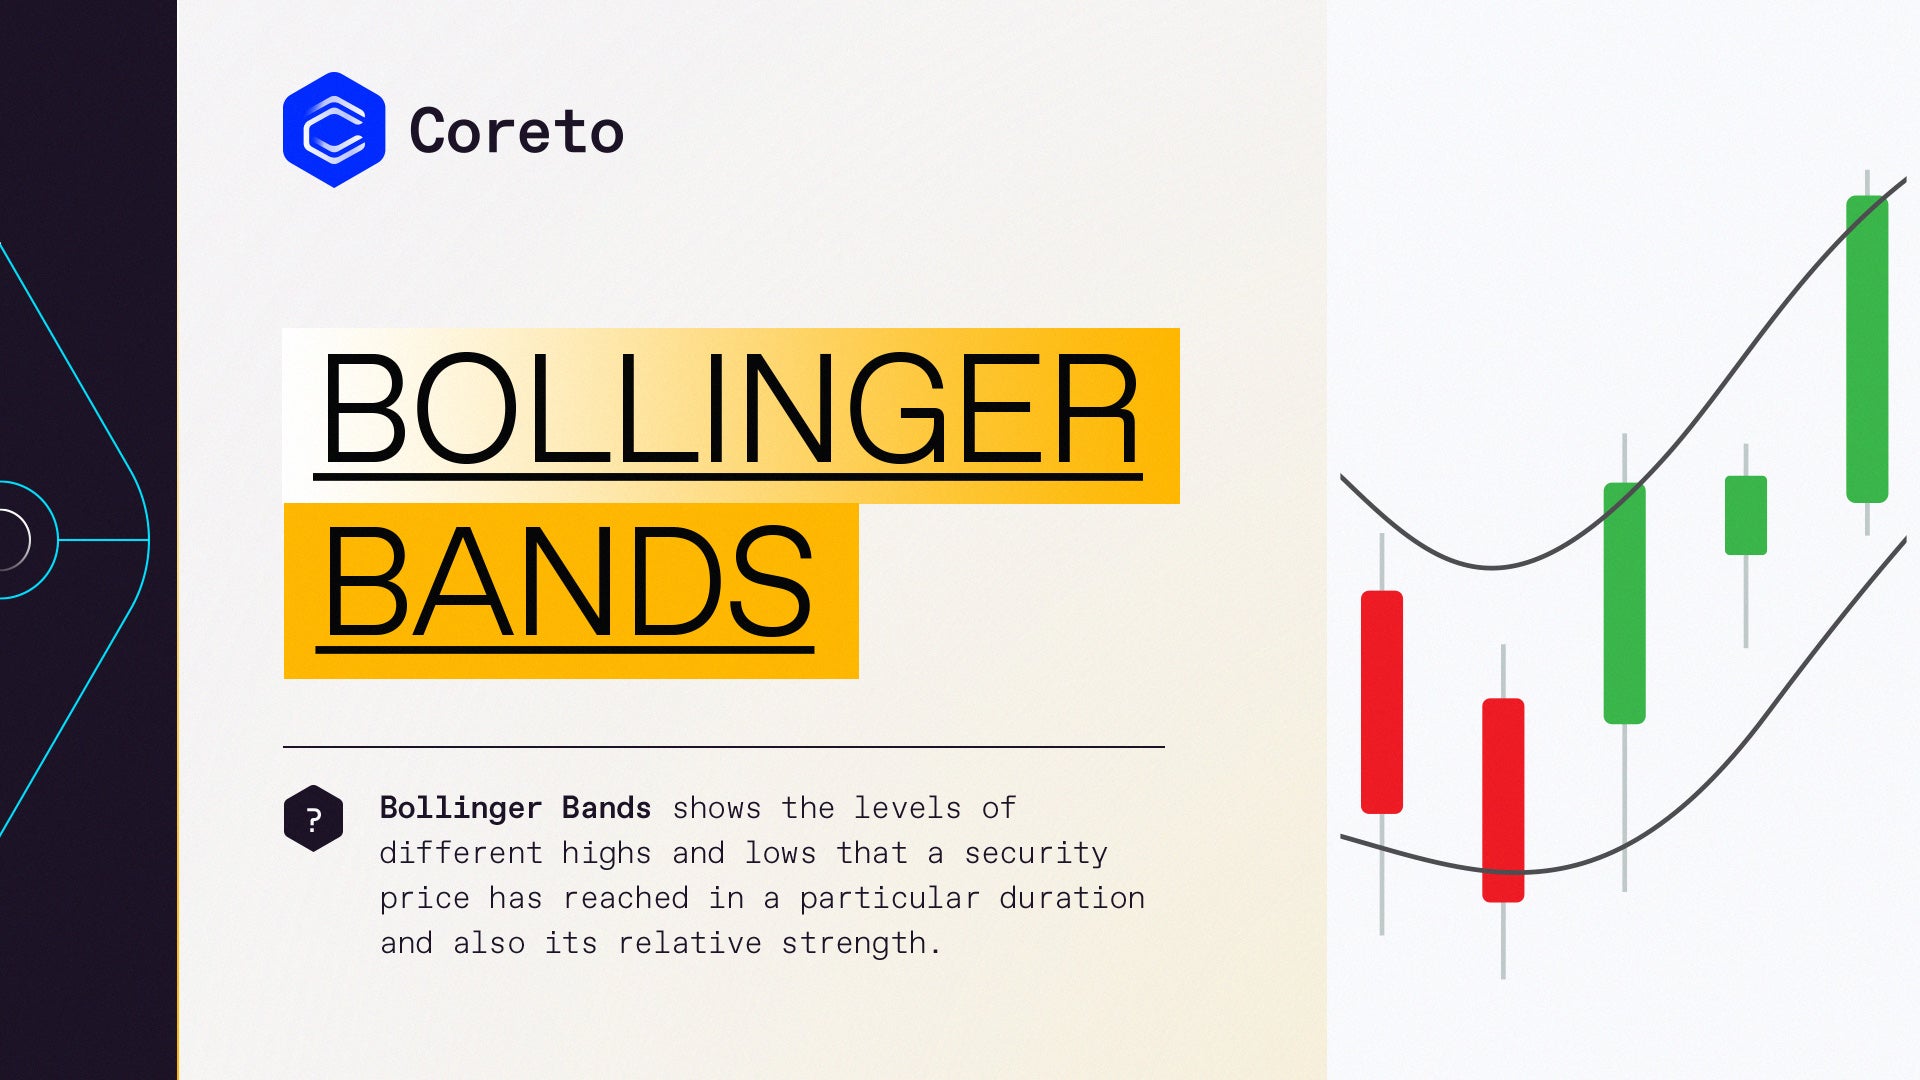
Bollinger bands were developed by technical trader John Bollinger in the 1980s. He designed them in order to discover opportunities that offer investors a higher probability of identifying when an asset is oversold or overbought.
They are useful for recognizing when an asset is trading outside of its usual levels, and are used mostly as a method to predict long-term price movements.
They contain three lines:
- the upper band;
- the middle band;
- and the lower band.
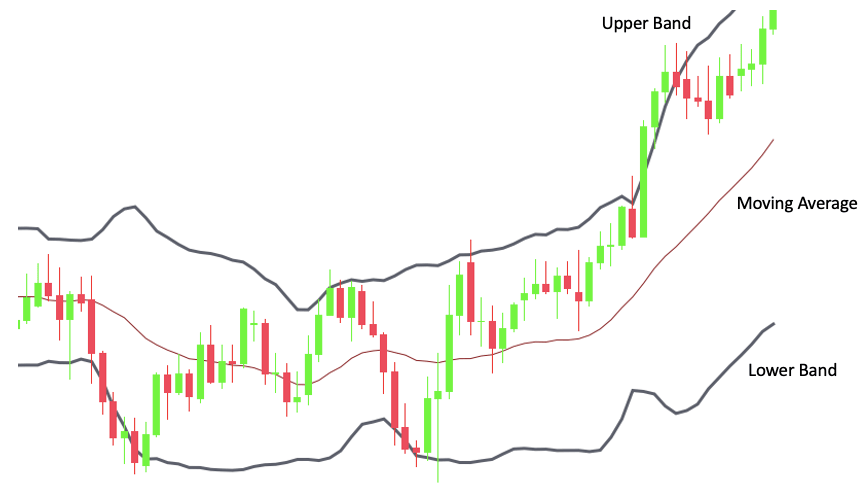
The middle band is a moving average, usually chosen by the trader.
The upper and lower bands are on either side of the moving average (middle) band. The trader decides the number of standard deviations they need the volatility indicator set at.
The position of these bands provides information on how strong the trend is and the potential high and low price levels that may be expected in the near future.
The advantages of Bollinger bands
Bollinger bands can be useful indicators of a trend in a market. When plotted automatically by a trading platform, they are easy to understand and can expand the perspective of a chart analysis.
The disadvantages of Bollinger bands
Being a lagging indicator, they cannot predict price patterns, meaning it’s not recommended to catch early price signals.
Make sure to use them together with other technical indicators to grow your accuracy rate when trading.

