- Home
- Education
- Trading Analysis
- Double Bottom Chart Pattern


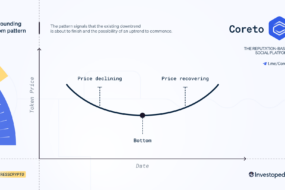
Double bottom pattern – two low points forming near a similar horizontal price level
The double bottom pattern entails two low points forming near a similar horizontal price level and signifies a
- potential bullish reversal signal.
A measured strengthening in price will occur between the two low points showing some support at the price lows.
Reserve your spot on our platform and start following & creating price signals today.
Coreto is a reputation-based social platform that bridges the interaction between projects, retail Investors, traders & much more, all based on a comprehensive trust system.