- Home
- Education
- Indicators
- Fibonacci Retracement indicato ...
The fibonacci indicator
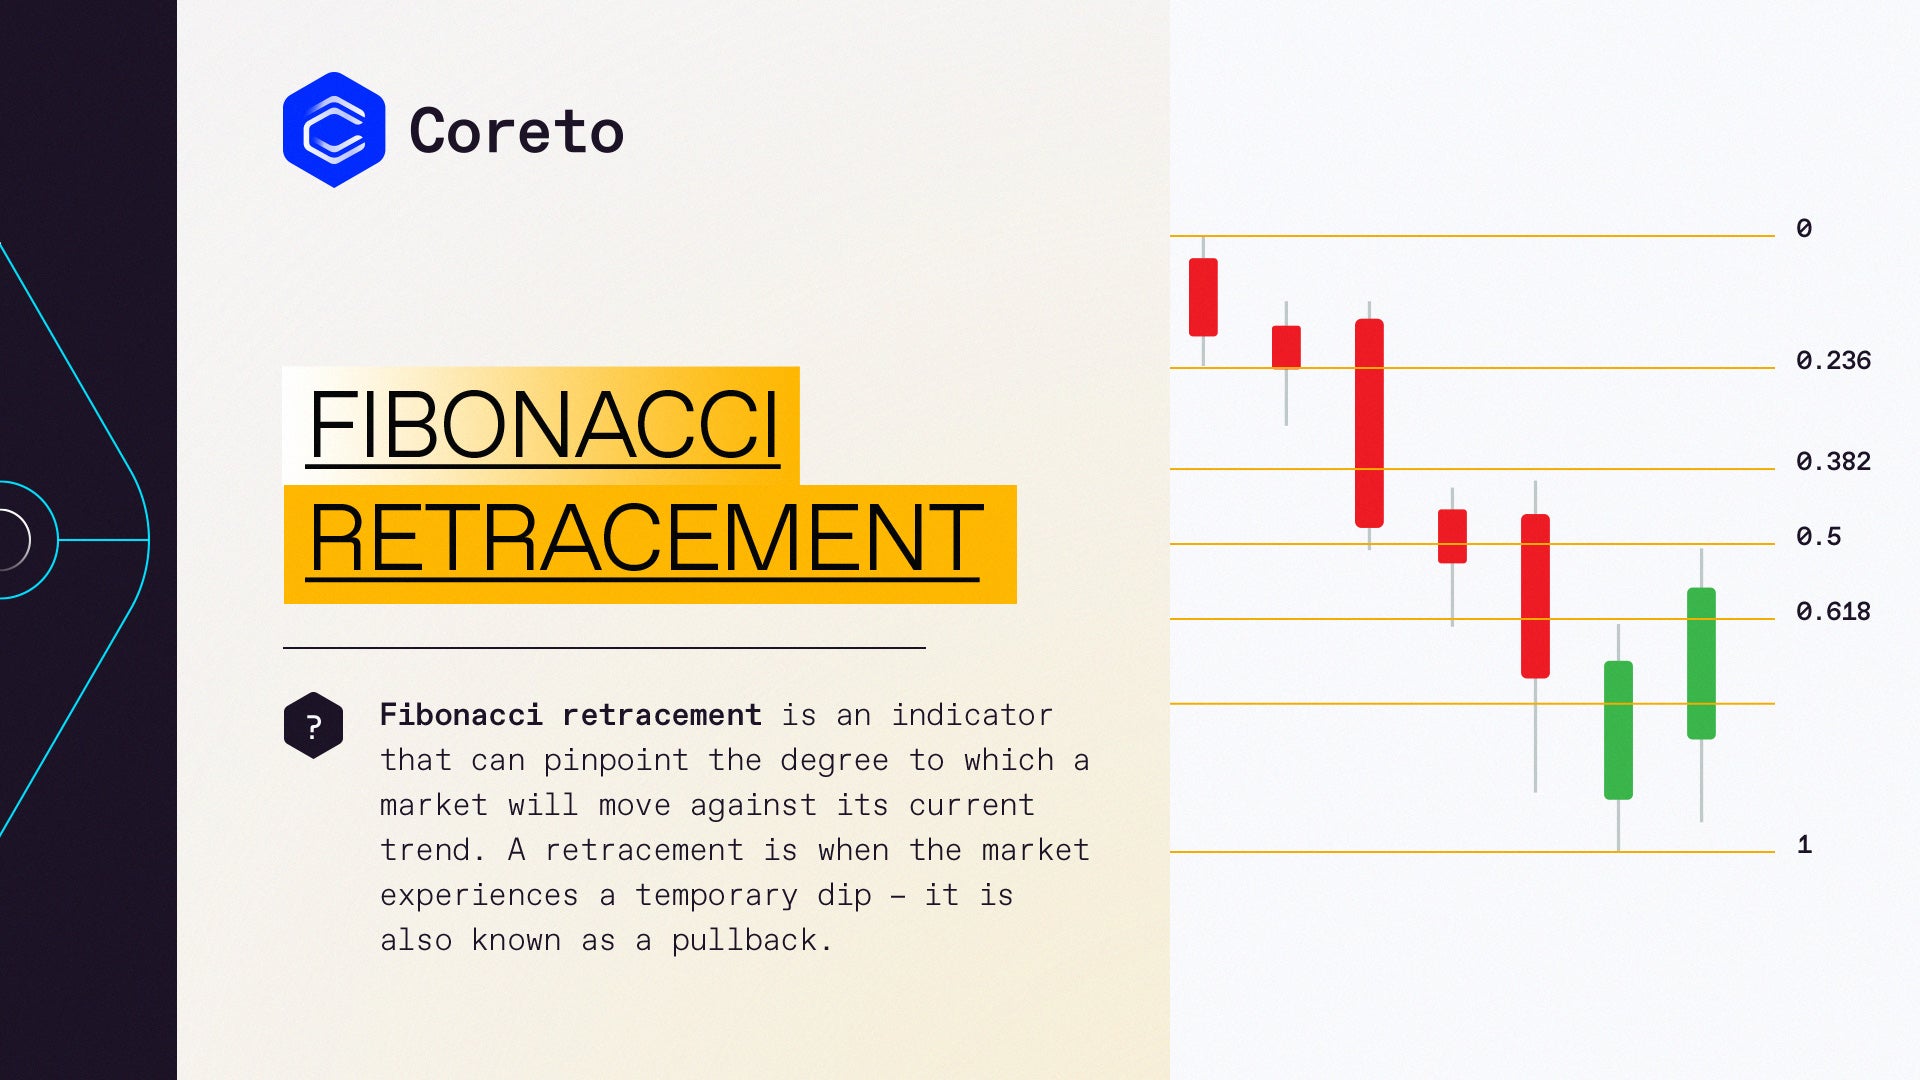
Fibonacci retracements are popular among technical traders. Their roots originating form the key numbers identified by mathematician Leonardo Fibonacci in the 13th century. Fibonacci’s sequence of numbers is not as important as the mathematical relationships, expressed as ratios, between the numbers in the series.
Fibonacci retracement levels are horizontal lines that point out the possible support and resistance levels where price could potentially reverse direction.
The first thing you should know about the Fibonacci tool is that it works best when the market is trending.
The idea is to go long on a retracement at a Fibonacci support level when the market is trending up.
And to go short on a retracement at a Fibonacci resistance level when the market is trending down.
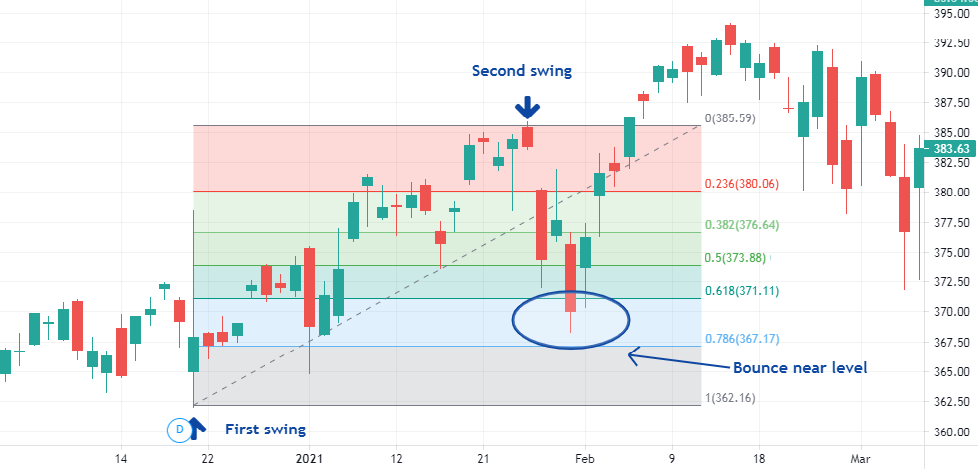
Fibonacci retracement levels
Fibonacci retracement levels are a predictive technical indicator since they attempt to identify where price may be in the future.
The theory is that after price begins a new trend direction, the price will retrace or return partway back to a previous price level before resuming in the direction of its trend.
To sum up, we often use Fibonacci retracements to identify the end of a correction or a counter-trend bounce.
- Corrections and counter-trend bounces often retrace a portion of the prior move.
- While short 23.6% retracements do occur, the 38.2-61.8% zone covers the most possibilities (with 50% in the middle).
This zone may seem big, but it is just a reversal alert zone. Other technical signals are needed to confirm a reversal. Reversals can be confirmed with candlesticks, momentum indicators, volume or chart patterns.

