- Home
- Education
- Trading Analysis
- Head and Shoulders Chart Patte ...
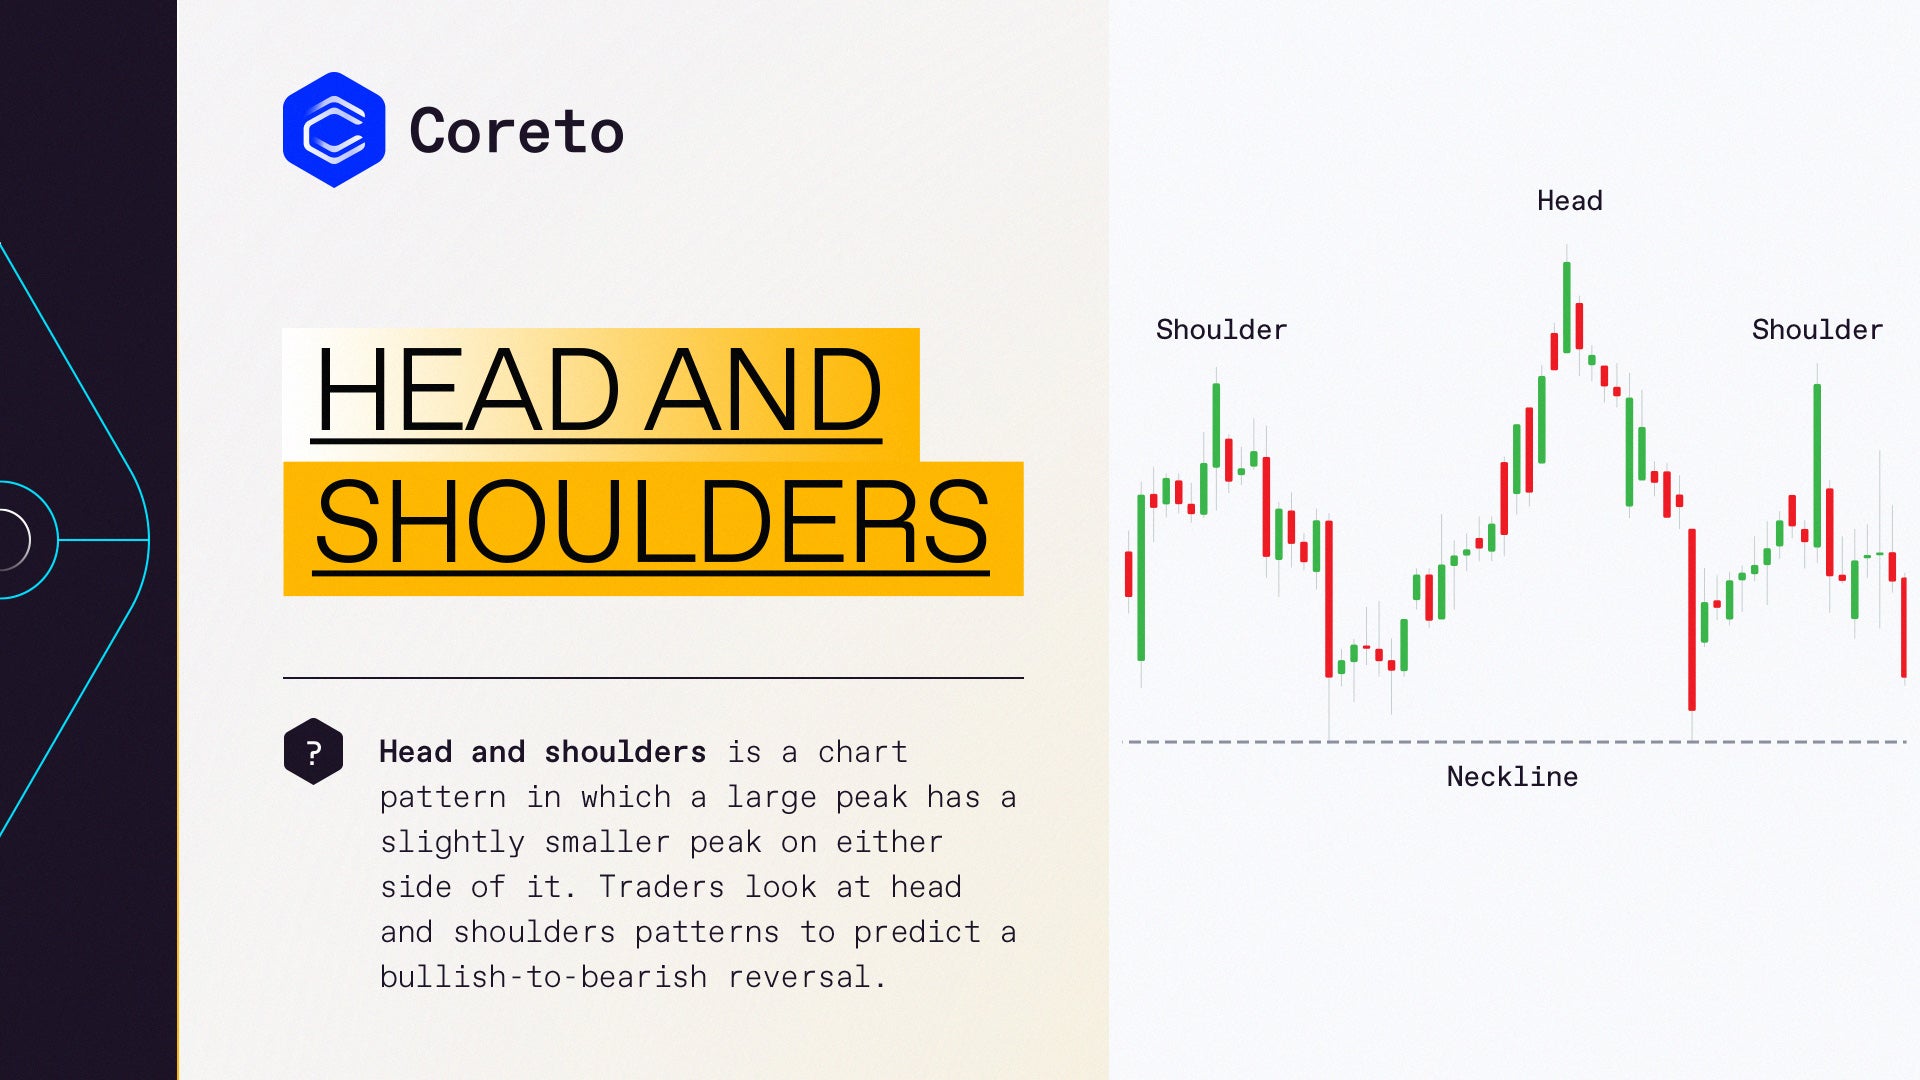
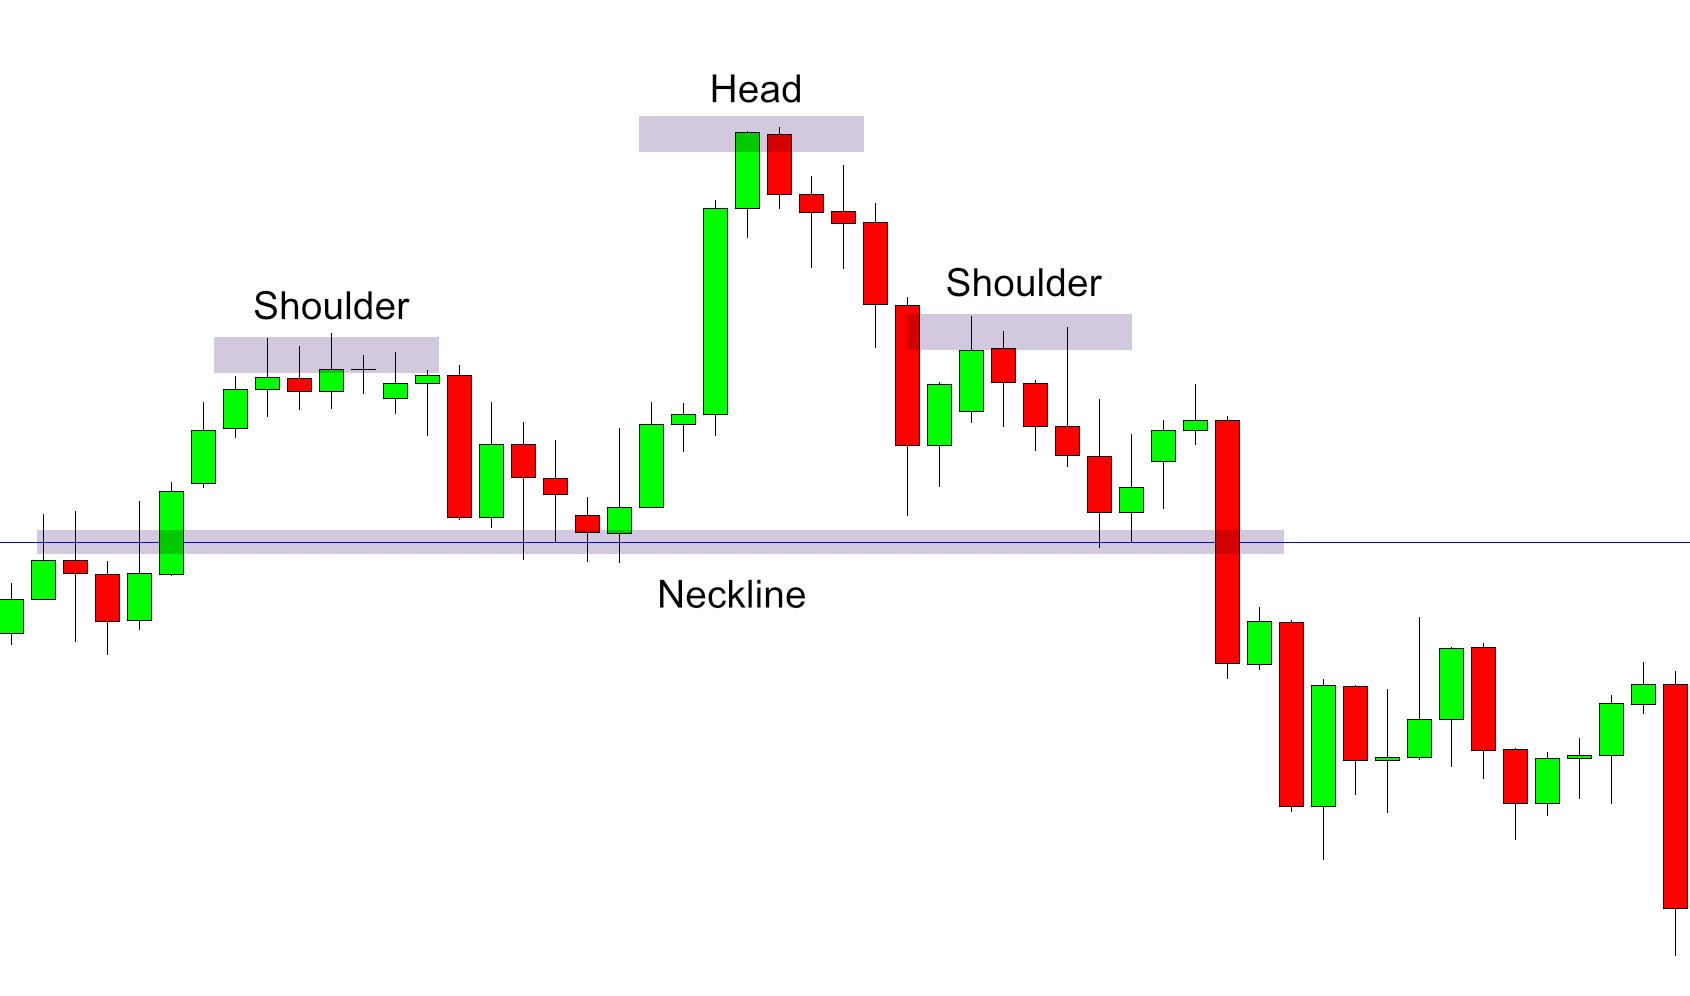
The head and shoulders pattern is a chart formation that appears as a baseline with three peaks: the outside two are close in height and the middle one which is highest.
Head and shoulders pattern technical analysis
In technical analysis, this pattern is used to predict a trend reversal from bullish to bearish.
- When the head and shoulders occurs, the pattern starts with the price rising and then pulling back, forming the left shoulder.
- After the price rallies for a second time, it creates a higher peak, which is known as the the head.
- Afterwards, the price pulls back again, and then rallies into a lower peak, forming the right shoulder.
