- Home
- Education
- Indicators
- Ichimoku Cloud
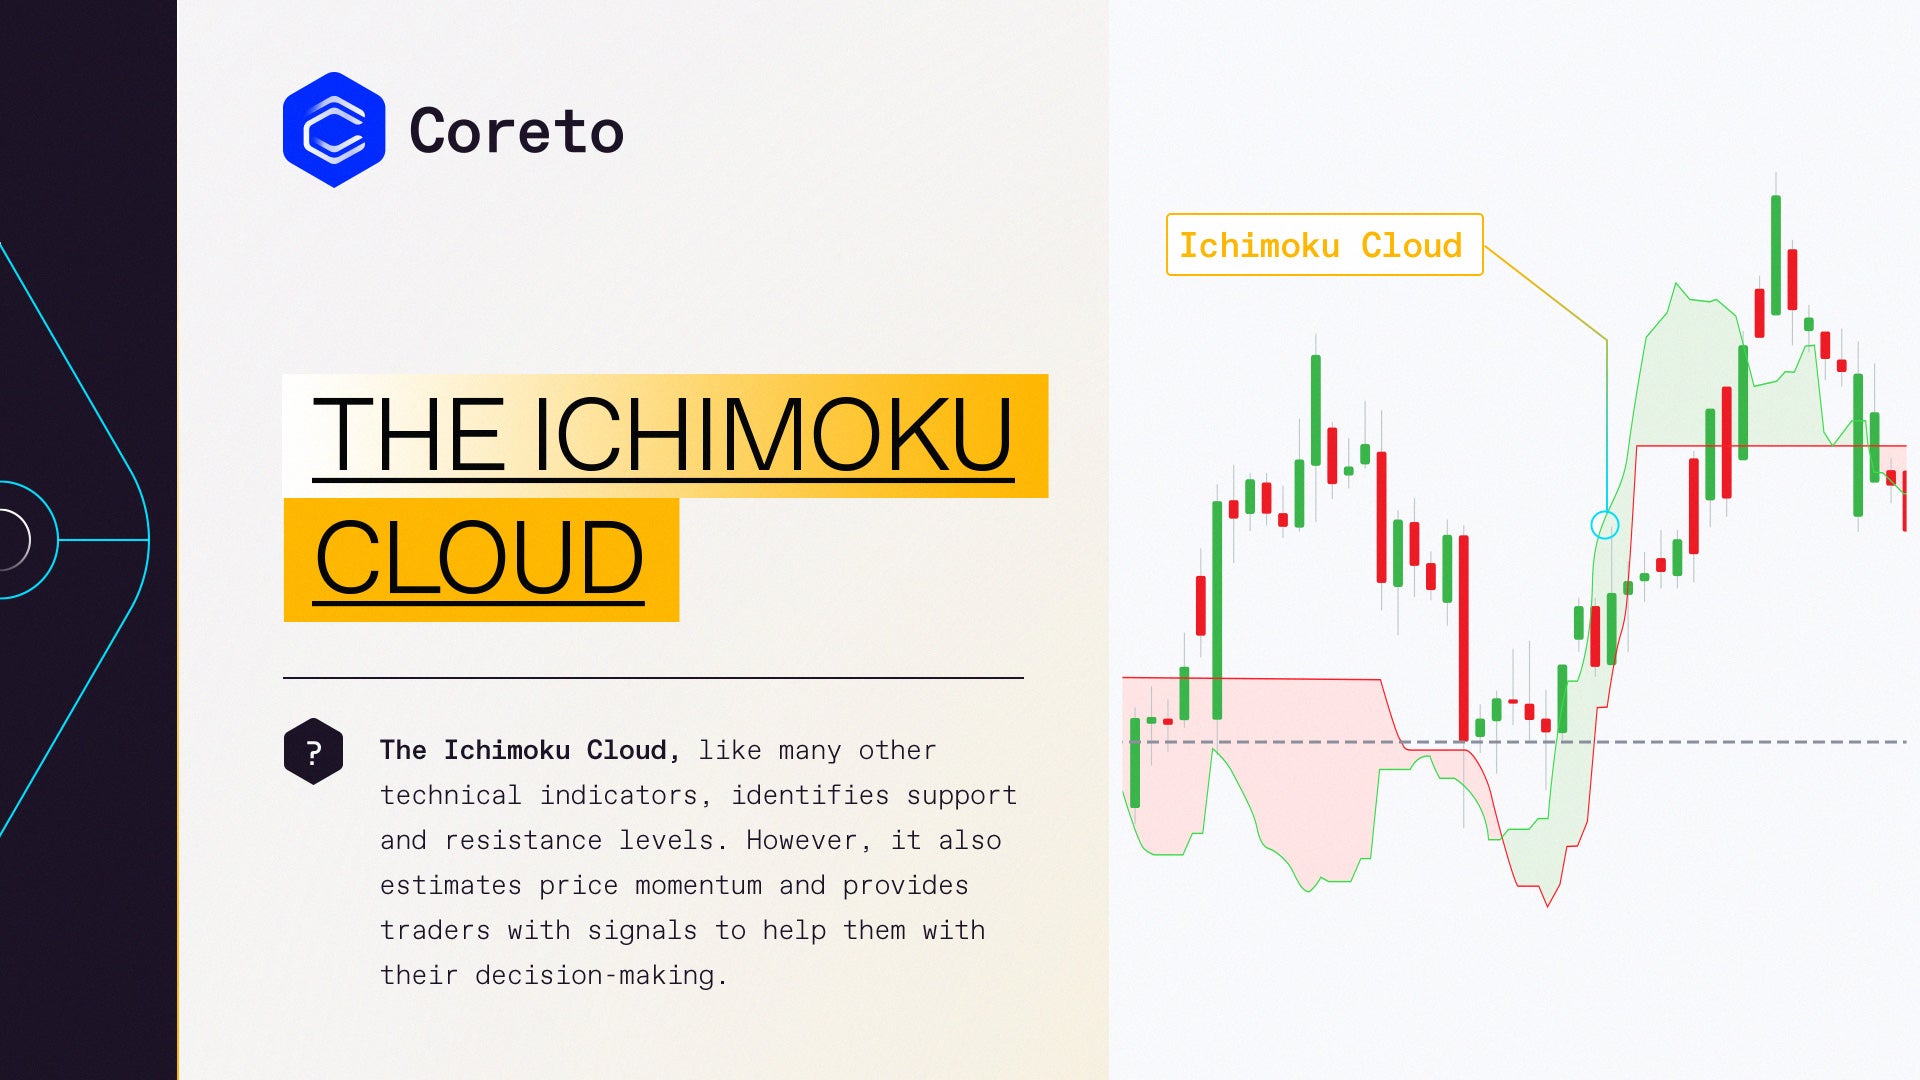
The Ichimoku Cloud identifies support and resistance levels. Also, it estimates price momentum and provides traders with signals to help them with their decision-making.
The technical indicator was developed by journalist Goichi Hosoda and published in his 1969 book. Even though the Ichimoku Cloud may seem complicated when viewed on the price chart, it’s actually a rather straightforward indicator. The concepts are easy to understand and the signals are well-defined.
The translation of ‘Ichimoku’ is ‘one-look equilibrium chart’ – which is exactly why this indicator is used by traders who need a lot of information from one chart.
Components of the Ichimoku Cloud
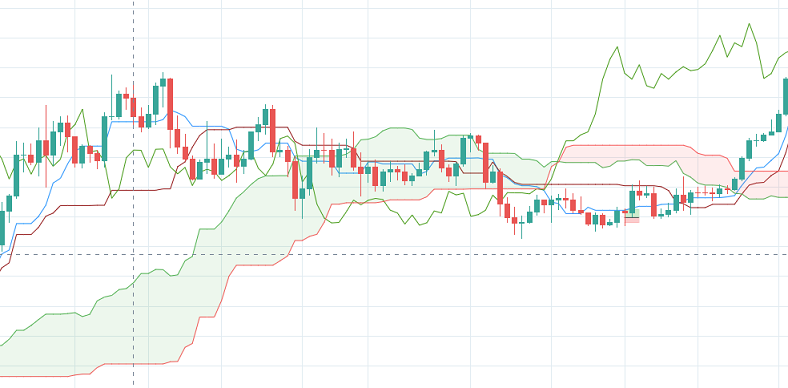
Several elements make up the Ichimoku Cloud. The elements consist of the following five moving averages:
1. Tenkan-Sen
The first component of the Ichimoku Cloud is the Tenkan-Sen, often a red line on the chart. It is a moving average that is calculated by taking the average of the high and the low for the last nine periods. The market is deemed to be trending if the Tenkan-Sen is moving up or down. But, if the line moves horizontally, it indicates a ranging market. It is calculated as follows:
2. Kijun-Sen
The Kijun-Sen is a support/resistance line that acts as an indicator of price movements in the future. It is usually a blue line. The Kijun-Sen is similar to the Tenkan-Sen, but takes a longer time frame into consideration, usually 26 periods compared to Tenkan-Sen’s nine periods. It measured by taking the average of the highs and lows for the last 26 periods. When plotting it on a chart, the Kijun-sen typically lags behind the Tenkan-sen since the former comprises longer periods than the latter.
3. Senkou Span A
Senkou Span is the average of the highs and lows of Tenkan-Sen and Kijun-Sen and is plotted 26 periods to the right. On a chart, the Senkou span A is an orange line. If the security price is above the Senkou span A (orange line), the top and the bottom lines become the first and second support levels, respectively. Conversely, when the price moves below the Senkou span A, the bottom and the top lines become first and second resistance levels, respectively.
4. Senkou Span B
It is calculated by taking the average of the high and low of the past 52 periods and plotting it 26 points to the right.
5. Chikou Span
The Chikou Span, also known as the lagging span, is represented by a green line. It is formed by taking the current price and shifting it back 26 periods to the left. If the Chikou span crosses the price from the bottom-up, it demonstrates a buy signal. But, if the line crosses the price from the top-down, it is a sell signal.
Limitations of the Cloud
- One of the downsides of the Ichimoku Cloud is that it uses historical data. Historical tendencies may not repeat in the future as traders may expect.
- Like any technical indicator, the Ichimoku Cloud may produce false signals. Also, depending on the time frame of the indicator, it may not account for larger trends.

