- Home
- Education
- Indicators
- MACD (Moving Average Convergen ...
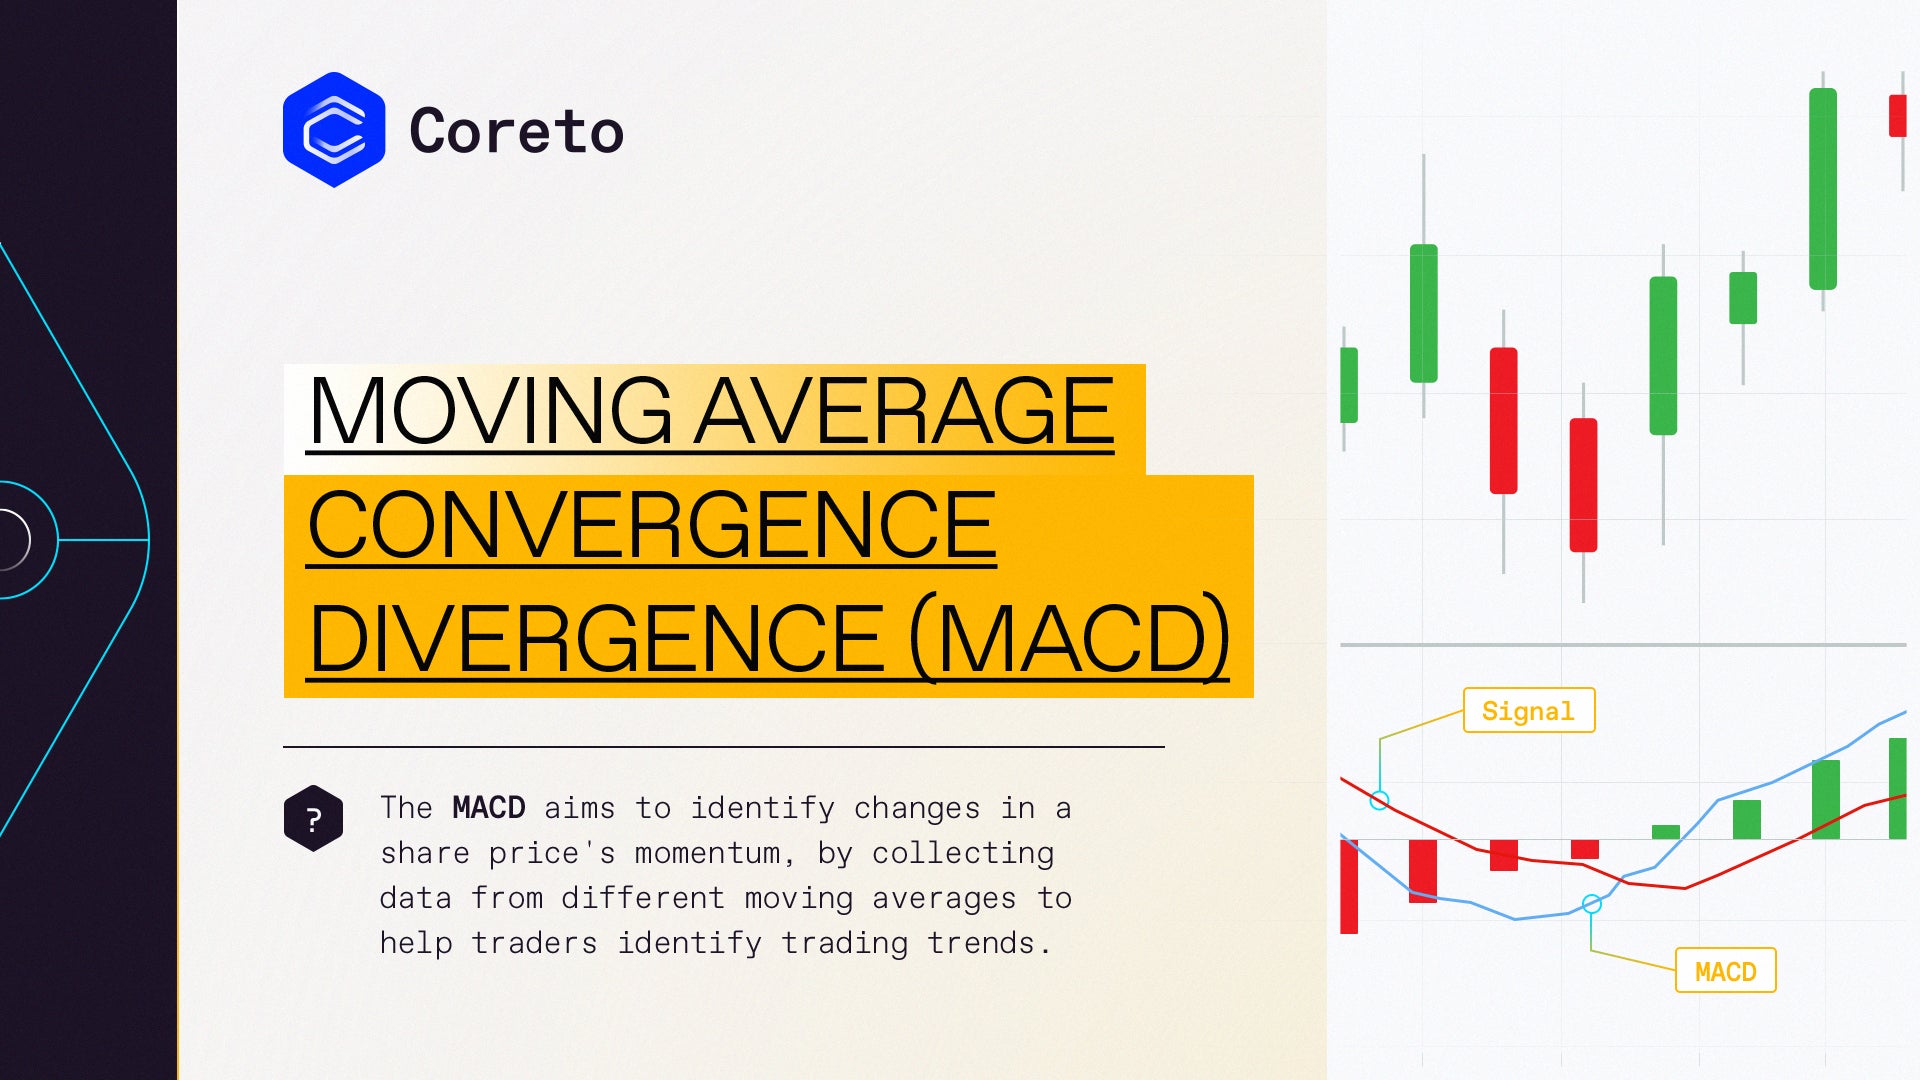
The MACD indicator was developed by Gerald Appel in the late seventies and it became one of the simplest and most effective momentum indicators available.
The indicator turns two trend-following indicators, moving averages, into a momentum oscillator by subtracting the longer moving average from the shorter one. As a result, the MACD offers the best of both worlds: trend following and momentum.
There are three main components of the MACD:
- The MACD Line, which represents the difference between two moving averages;
- The Signal Line, which is a moving average of the MACD Line;
- The Histogram, which is a graphical representation of the distance between the MACD Line and Signal Line.
As an indicator that detects changes in momentum by comparing two moving averages, it can help traders identify possible buy and sell opportunities around support and resistance levels:
For a potential BUY signal, the shorter-term 12-period exponential moving average (EMA) crosses over the longer-term 26-period EMA.
For a potential SELL signal, the Moving Average Convergence Divergence crosses below the zero line.
It’s important to understand that these are two moving averages with different speeds, and one of them will obviously be quicker to react to price movement than the slower one.
In this case, when a potential new trend occurs, the faster line (also called the MACD Line) will react first and eventually cross the slower line (also called the Signal Line).
When the crossover takes place and the fast line starts to move away from the slower line, it will often point out that a new trend has formed.

