- Home
- Education
- Indicators
- Stochastics RSI


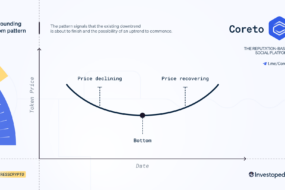
Market movement evolves through buy-and-sell cycles that can be identified through Stochastics.
These cycles often reach a peak at overbought or oversold levels and then shift in the opposite direction.
Stanley Kroll and Tushar Chande first described the indicator in “The New Technical Trader” which appeared in 1994.
- It indicates an oversold situation when the value goes below 0.20.
- A reading greater than 0.80 means that the RSI may be reaching an overbought state.
Stochastics short-term trends
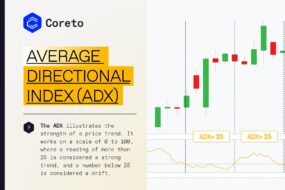
Together with identifying overbought/oversold situations, the indicator can be used to determine short-term trends.
Indicator effectiveness
Traders should use Stochastics indicator with other technical analysis chart patterns to maximize its effectiveness, due to the high number of signals that it produces.
Coreto is a reputation-based social platform that bridges the interaction between projects, retail Investors, traders & much more, all based on a comprehensive trust system.